 OriusBotHelp center
How do I read my server’s analytics (activity and growth)?
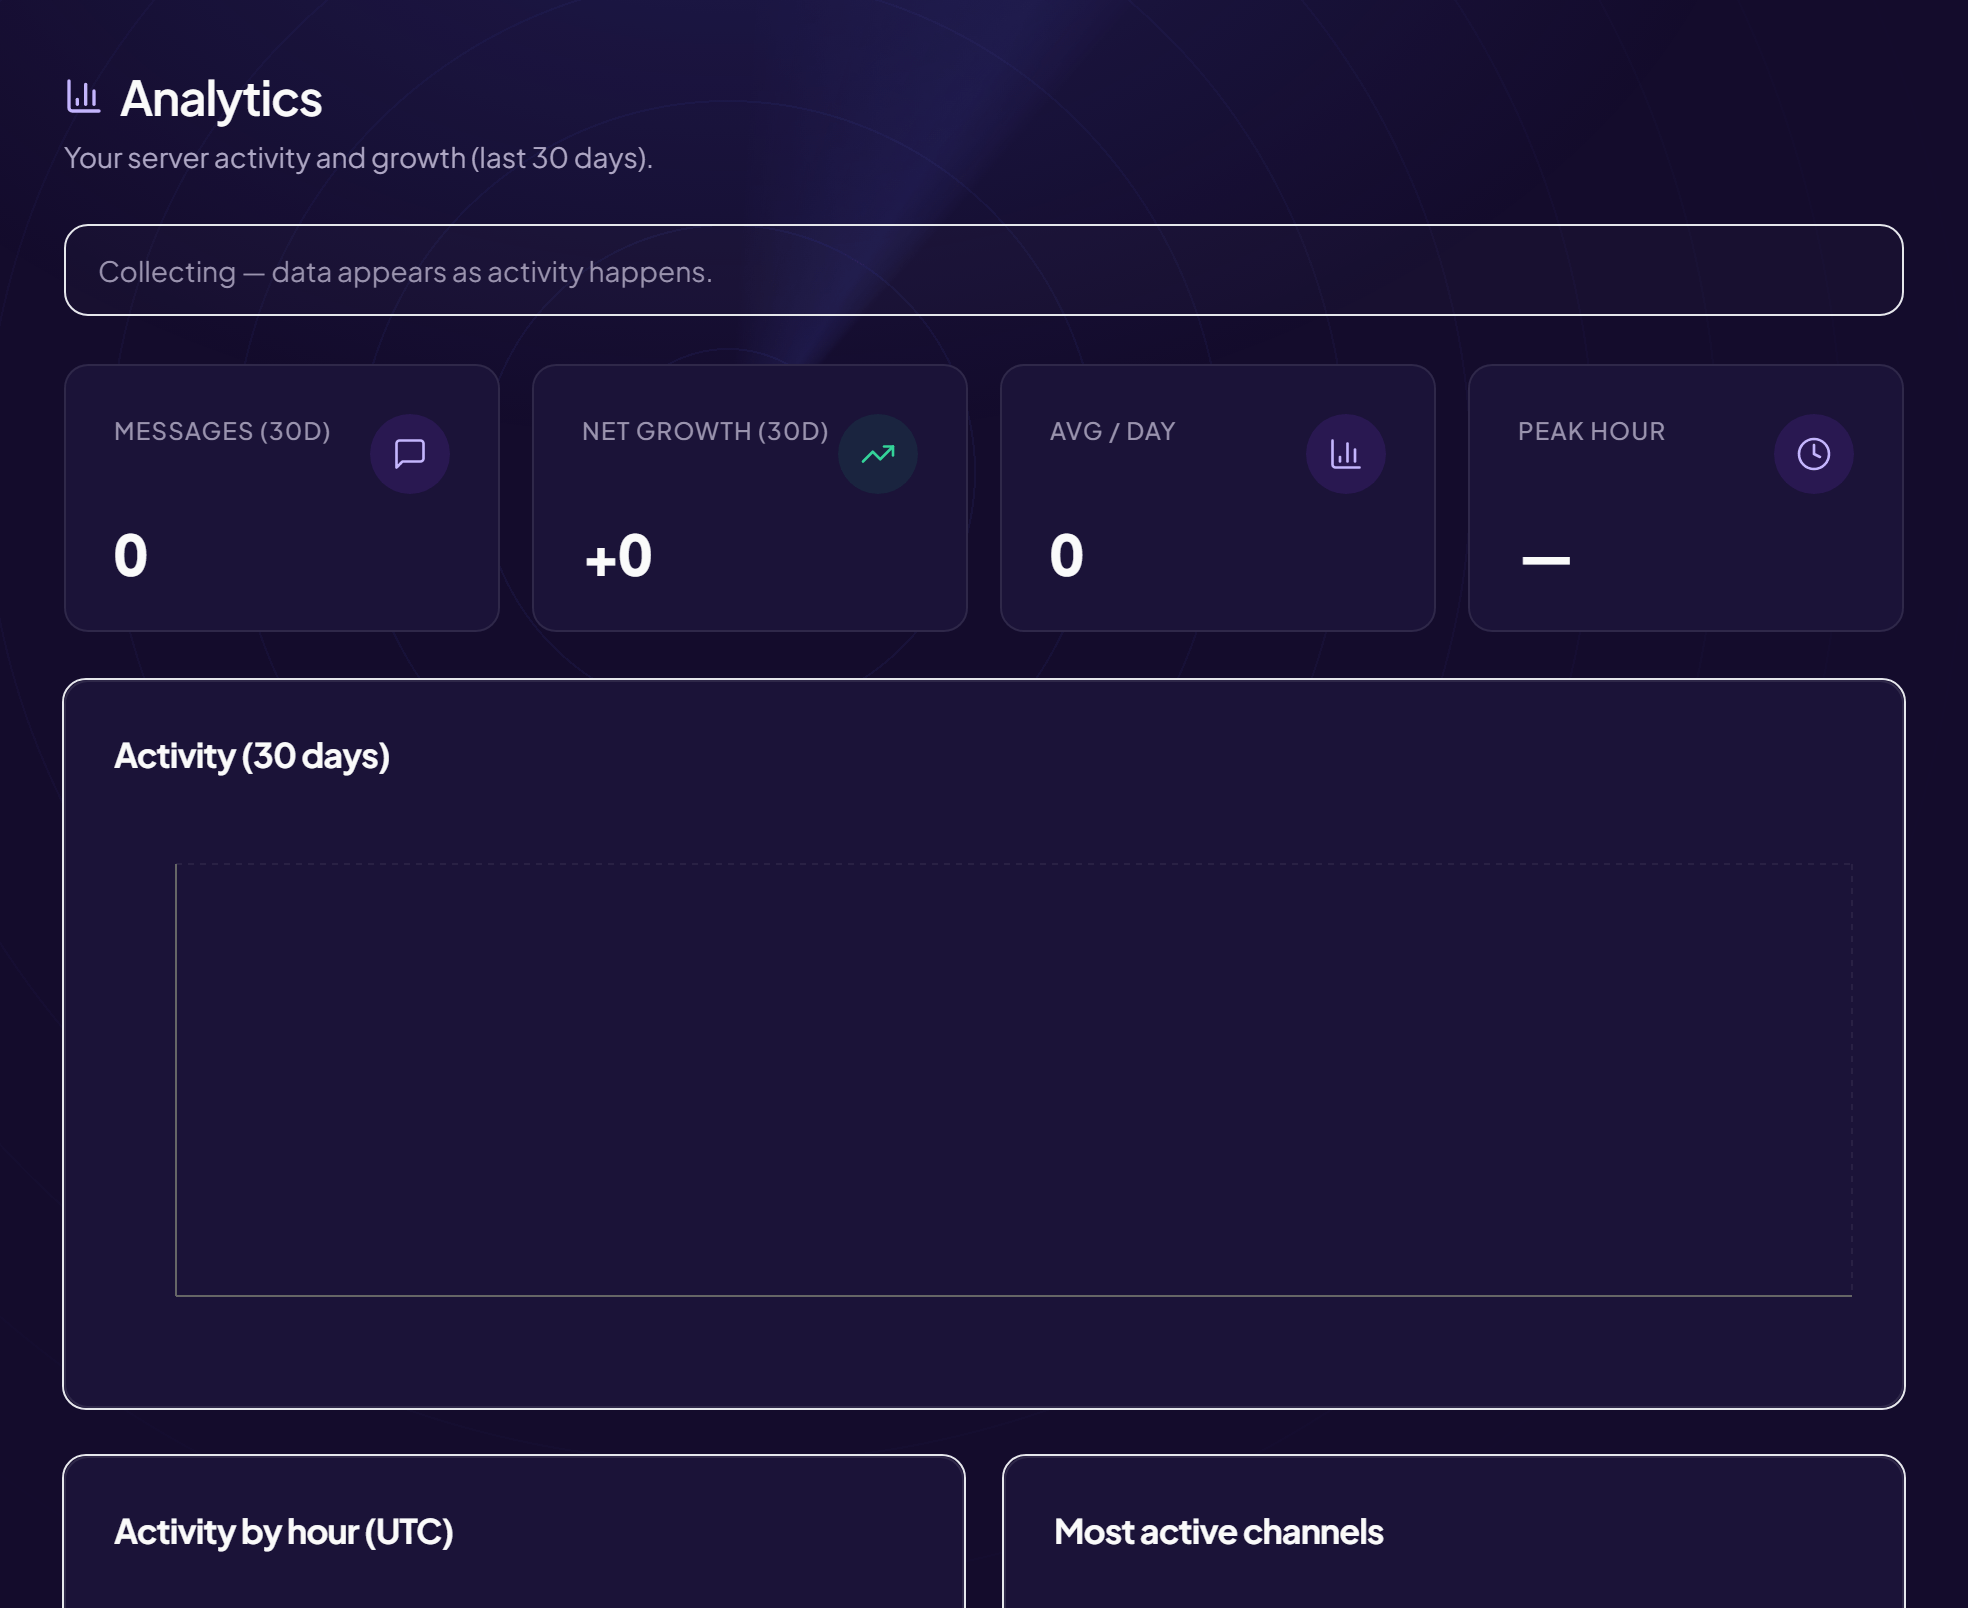
The Analytics page shows your server’s activity and growth over the last 30 days. When it has just been turned on: “Collecting — data appears as activity happens”.
Go there
Home › Analytics menu.
The key figures
| Figure | What it is |
|---|---|
| Messages (30d) | The number of messages sent over the period. |
| Net growth (30d) | Joins minus leaves. |
| Average / day | The average number of messages per day. |
| Peak hour | The hour when the server is most active. |
The charts
- Activity (30 days): the day-by-day curve.
- Activity by hour (UTC): the distribution across the day. Careful, the time is in UTC (universal time), not in your time zone: in France, add 1 or 2 hours.
- Most active channels: the ranking of channels.
More hindsight with Pro
The 7- and 30-day periods stay free. Pro goes back up to 90 days and a year and compares each period with the previous one.
What is it for?
The peak hour tells you when to post an announcement, hold an event or have moderators available.
Still stuck?
Contact support with the title of this article, the step where you are stuck and what you see on screen.
Contact support More articles: Overview and serverLast checked: 13 November 2026.